
Download Center
Download various Excel based Risk pricers and models. Methodologies are available within workbooks. Most models rely on VBA coding.
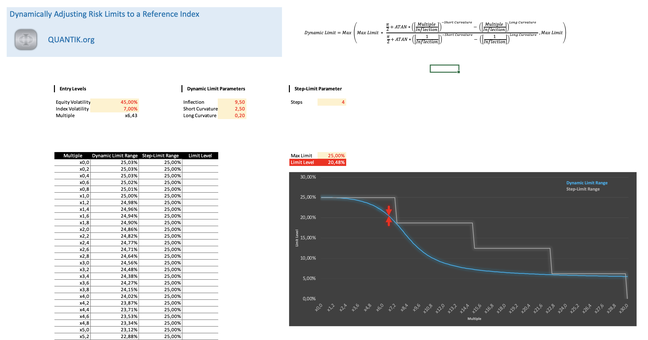
The model proposes a method to adjust Risk limits to a reference index. More specifically, the adjustment consists in adapting an equity exposure limit considering the volatility of a stock versus a reference index / benchmark. The higher the stock volatility versus the index, the lower the limit (and the lower the exposure to the stock allowed). The model proposes an alternative to standard static limits, usually expressed in steps.
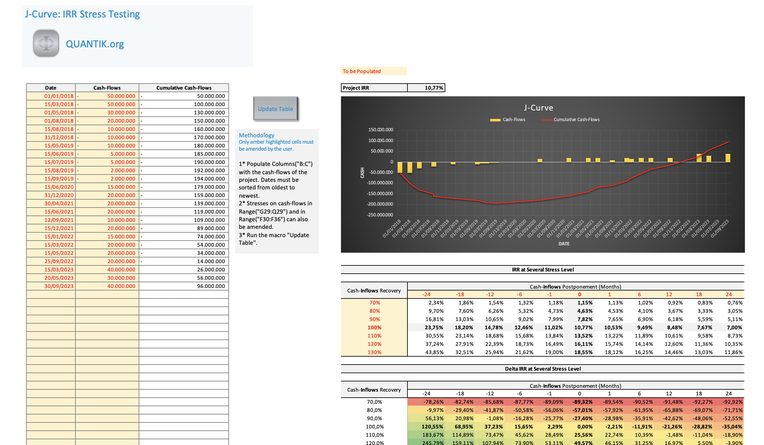
The purpose of the model is assessing the impact of stressing cash-inflows on a project IRR. Stress-testing consists in postponing cash-inflows, and amending the expected recovery of those inflows.
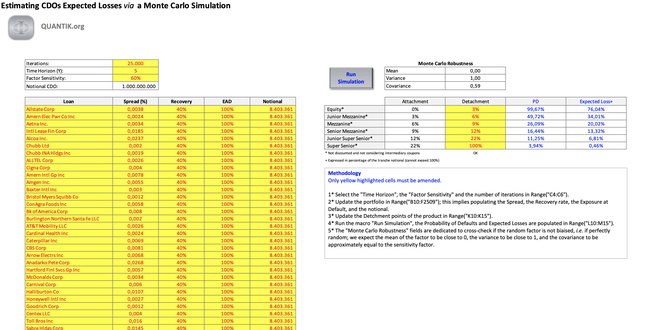
The model illustrates the mechanics of a CDO transaction. Starting from PD, EAD, and LGD at the loan level, one simulates the Expected Loss per CDO tranche. Since the Monte Carlo simulation requires a random factor, one uses a dedicated built-in function. A robustness check is performed to cross-check the randomness of the factor.
The model approximates the book value of a Private Equity project by discounting Cash-Flows. The Terminal Value of the investment depends on several stresses performed on the Financial Statements. The model uses a simplified version of statements applicable to Financial Institutions.

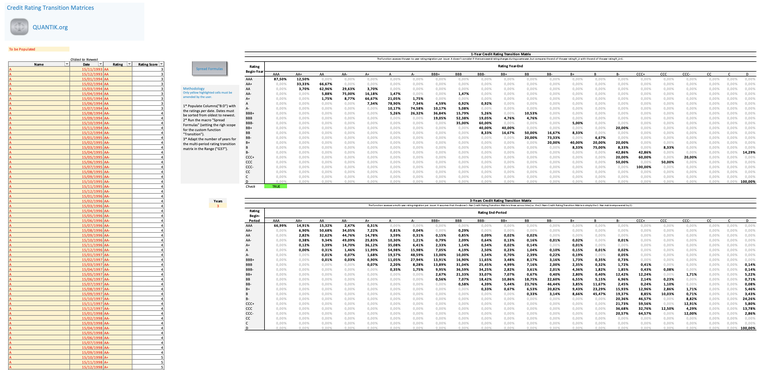
The purpose of this model is assessing the probabilities of rating transitions based on a sample of historical credit ratings. Based on historical credit ratings per name, the transition matrix identifies the probability that the credit rating decreases or increases by x notches. From strong assumptions, it is also possible to derive from the 1-year matrix a multi-period transition matrix.
Building a Variance-Covariance / Pearson Correlation Coefficient matrix in Excel can be cumbersome using formulas, the purpose of this model is to produce those matrices via VBA. Users having Bloomberg can easily update time-series by specifying the ticker, other data sources can obviously be used by overriding series; as long as the format is respected.


This model is first dedicated to analyse the Options sensitivities to any change in input data. European Options are priced using a Black and Scholes model, American Options are priced using a Bjerksund-Stensland approximation. Greeks are derived from the Black model and only are applicable to European options (American Options sensitivities remain very similar).
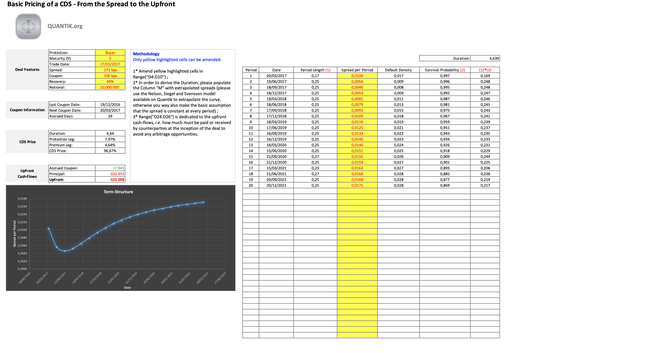
The purpose of the model is giving the intuition of the Reduced-Form model (or Hazard Rate approach) used to price CDS. More specifically, how the Upfront price can be derived from the relationship between the Protection leg and the Premium leg. Also, one can see how the Duration can quickly be estimated from a few market parameters.
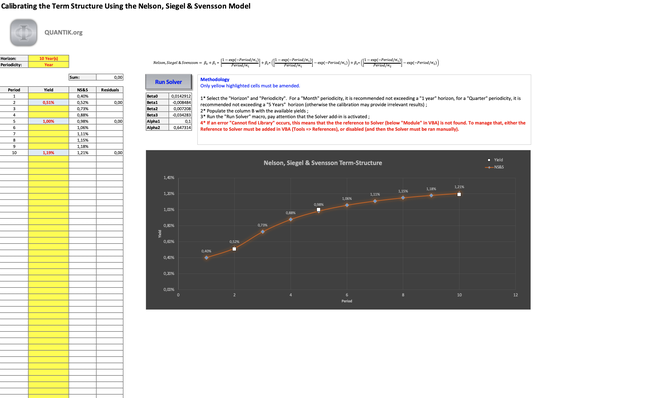
The Nelson, Siegel and Svensson Model is commonly used to fit the term structure of interest rates; the purpose of the model is giving the intuition of the fitting. An OLS method is used to minimise the difference between the observed data points and the approximated ones.
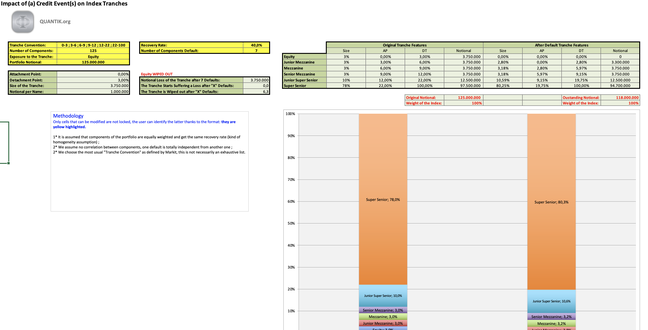
The model assesses the impact of the default of one or several index components on the attachment point, detachment point, and size of index tranches. This simplistic model assumes all components are equally weighted and have the same recovery.
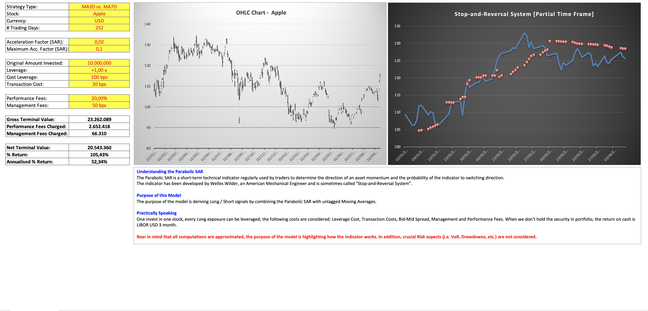
This model has been built in order to understand the intuition behind this indicator frequently used by traders. A wide range of costs are considered in order to obtain a reasonably reliable net return over the period (i.e. Bid/Ask Spread, Leverage Cost, Transaction Cost, Fees, etc.).
This calculator has been built to consider three company types (Listed Company: Z1 ; Private Company: Z2 ; Cyclical Company: Z3). Zone of Discriminations have been been set up as reported by the original Z-Score model.

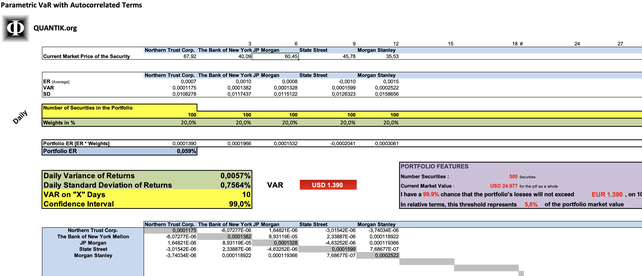
This Parametric and Monte-Carlo VaR can only be applied to ETD equities (the approach is more sophisticated for Fixed Income securities or Derivatives). Thanks to the Variance-Covariance matrix, a portfolio of 30 securities can be considered.
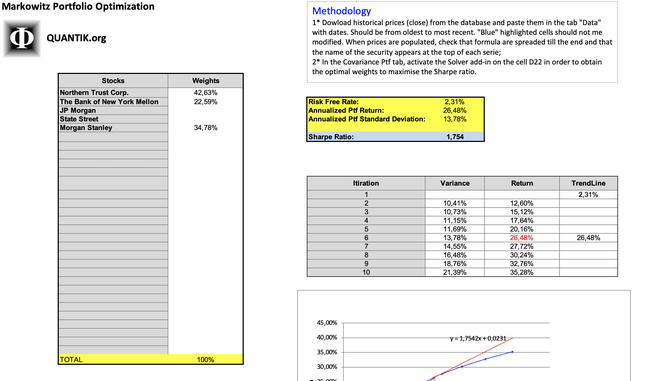
Thanks to the Variance-Covariance matrix, a portfolio of 30 securities can be considered. In order to maximise the Sharpe ratio and to draft the Markowitz efficient frontier, the Solver add-in is required.

It is assumed that the function follows a Standard Normal Distribution. Bear in mind that the joint CDF remains an approximation (cf. example in the workbook).